Data Science · NLP
Twitter Election Analysis
Research Overview
In my latest research project, I investigated how social media analytics can predict elections. By analyzing millions of tweets about the 2020 US Presidential candidates, I discovered some interesting correlation between Twitter engagement and actual voting patterns.
Using advanced natural language processing and machine learning techniques, I developed models to achieve higher accuracy in predicting state-level electoral results. This work demonstrates how data and sentiment analysis can broaden our understanding of political behavior in the digital age.
Twitter's Political Mood
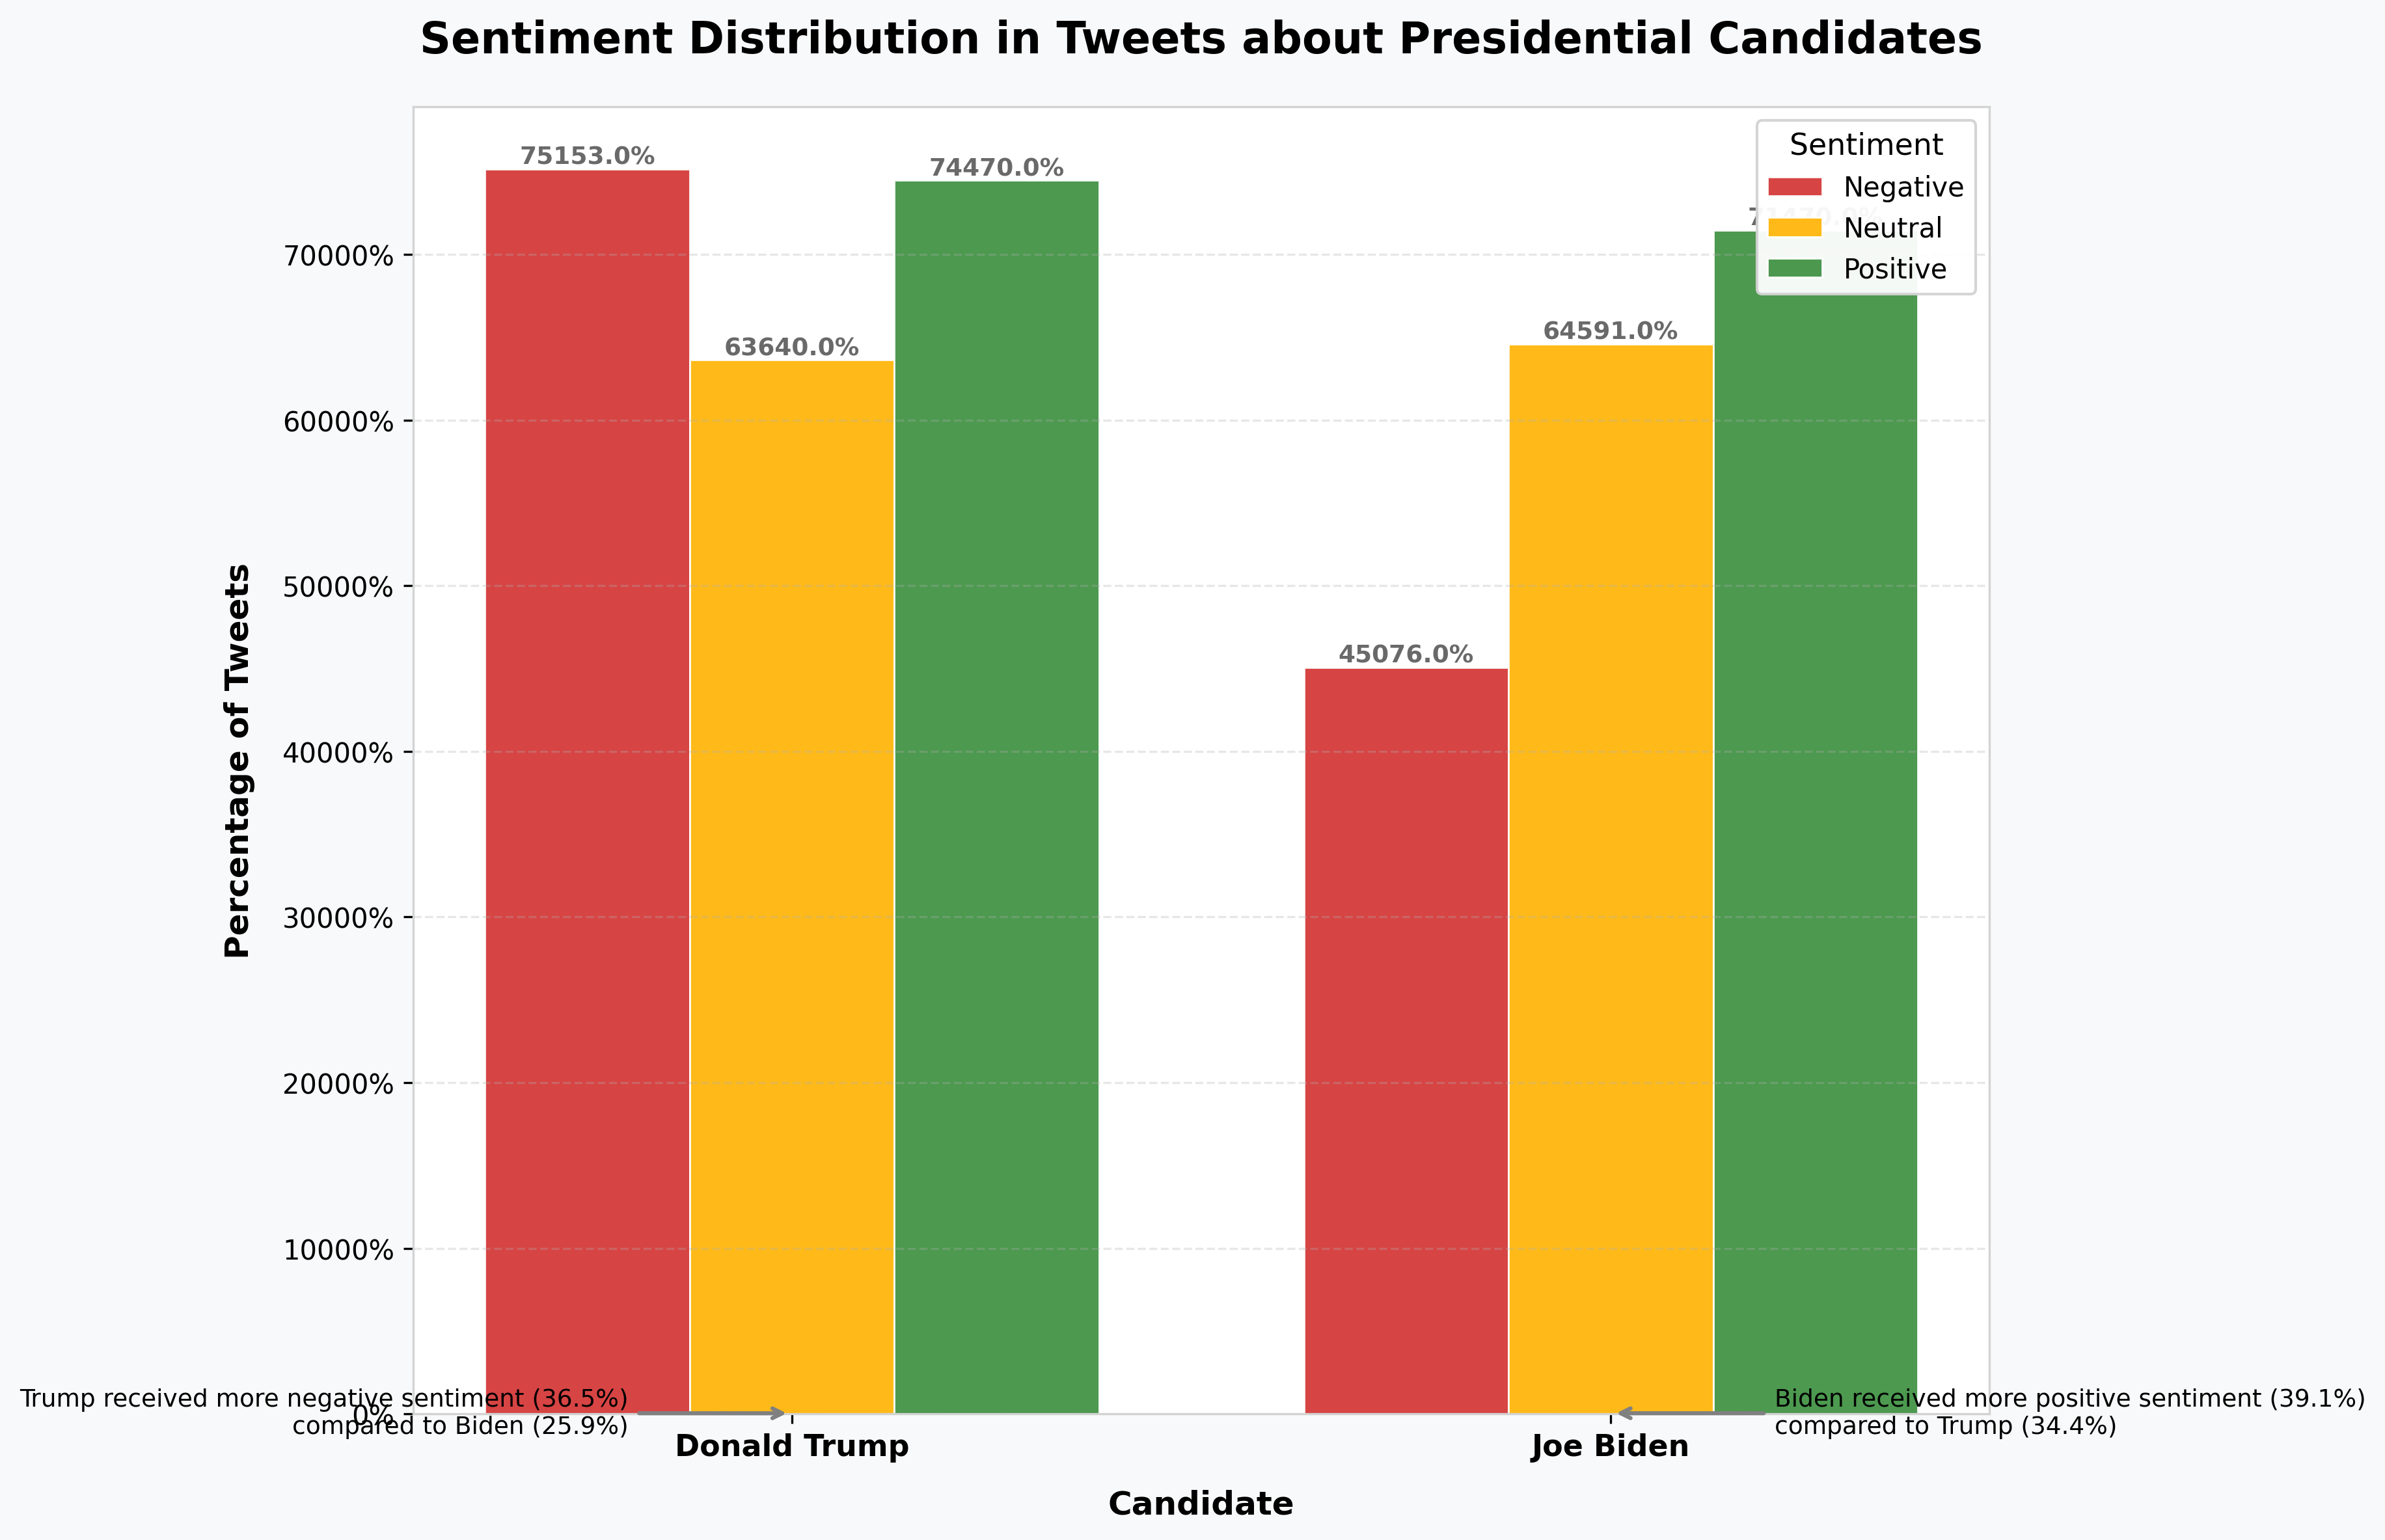
My analysis revealed striking differences in how Twitter users perceived the candidates. Biden received significantly more positive tweets (39.1%) compared to Trump (34.4%), while Trump faced more negative sentiment (36.5% vs Biden's 25.9%). These sentiment patterns aligned remarkably well with the final election results.
The bar plot below shows the distribution of positive, neutral, and negative tweets for each candidate during the election period. The disproportionate volume of negative sentiment toward Trump is an indicator of final electoral outcomes.
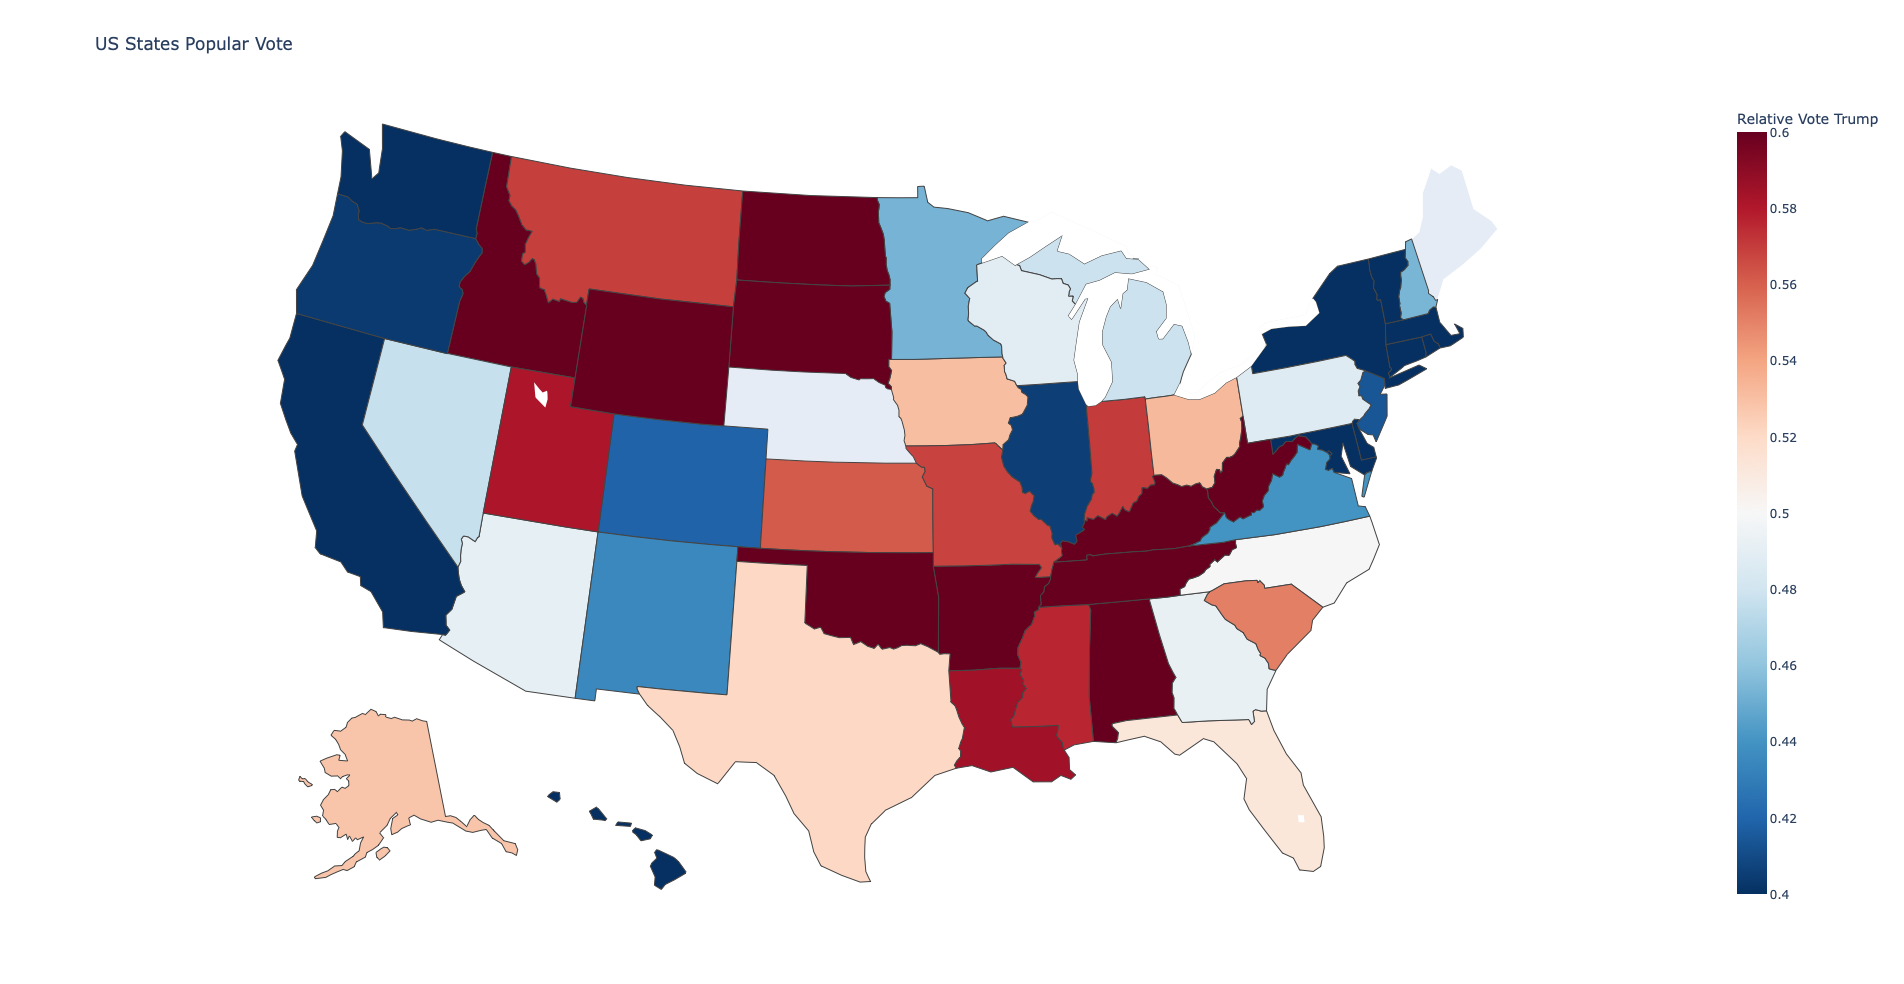
Geographic Patterns: Popular Vote
One of the best ways to visually see how popular elections might go is to look at geographic heat maps of the US. Here we have mapped, state-wise, which candidate had the highest voter outcome. Red represents the Republican nominee Donald Trump, blue the Democratic nominee Joe Biden. The electoral patterns show big regional variation — states like New York and California lean heavily toward Biden, while Texas and Florida lean Trump.
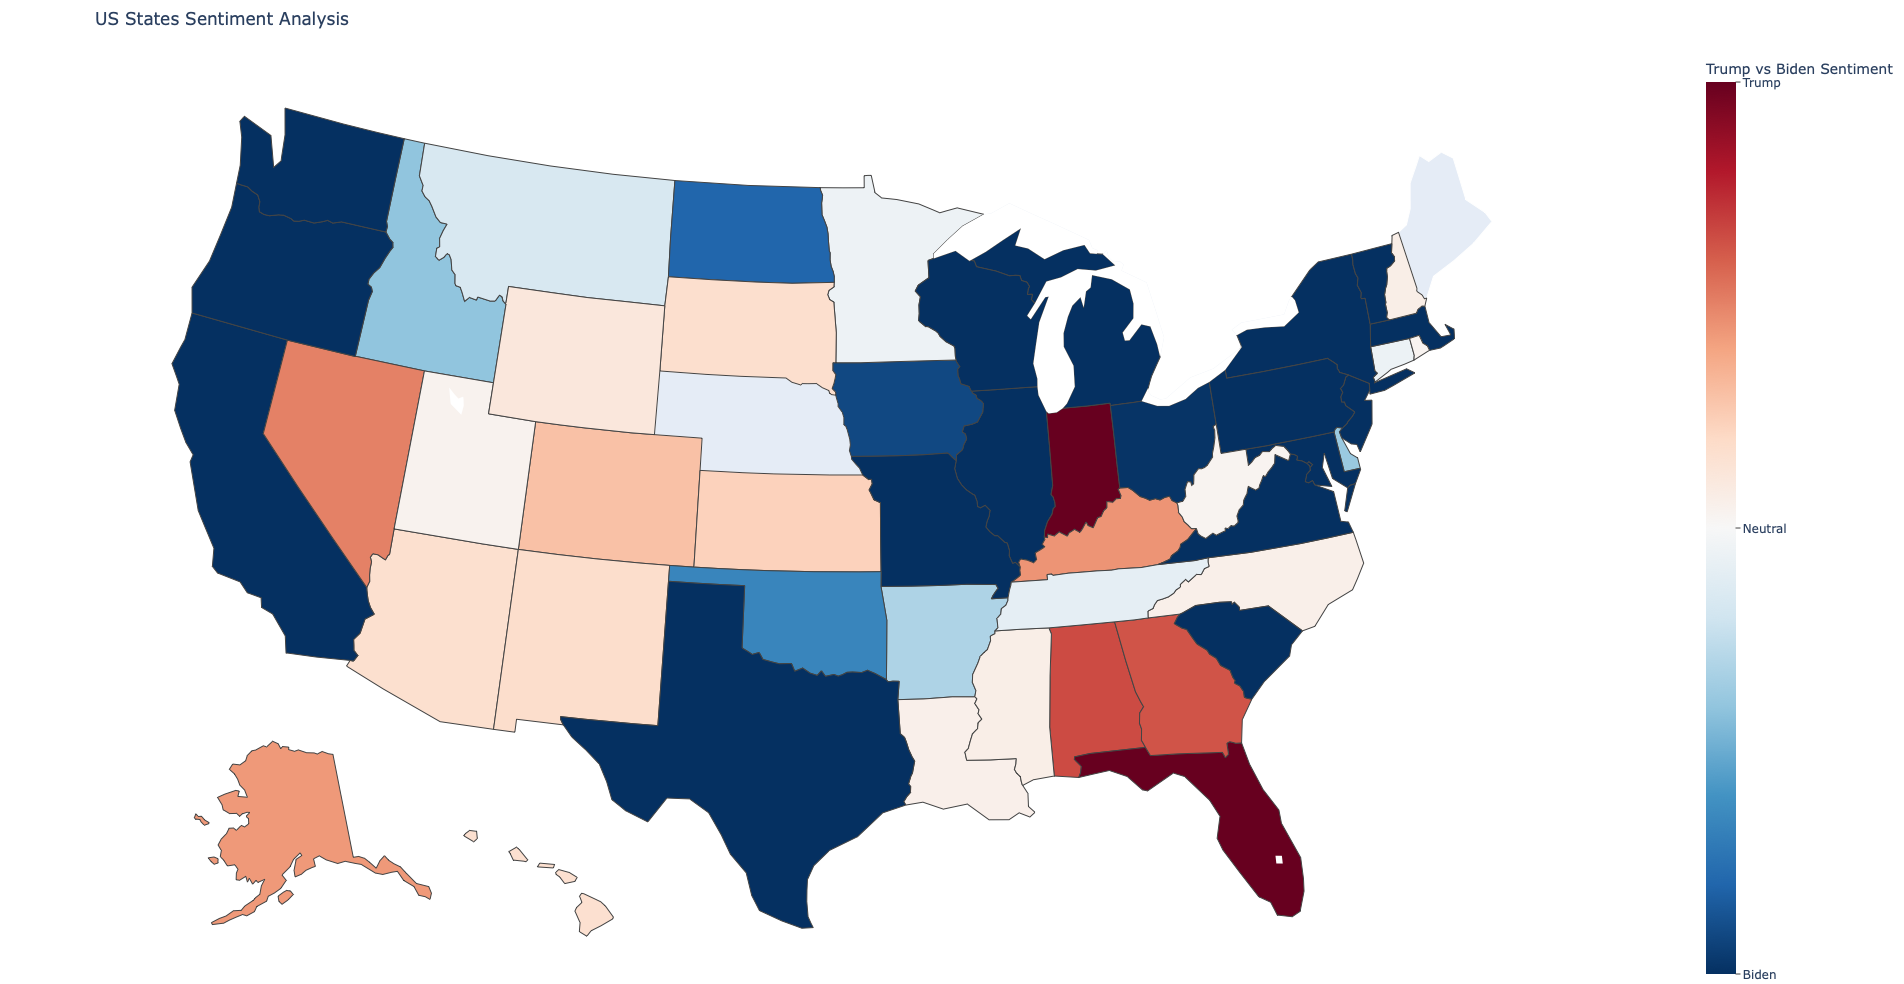
Sentiment & Engagement Realities
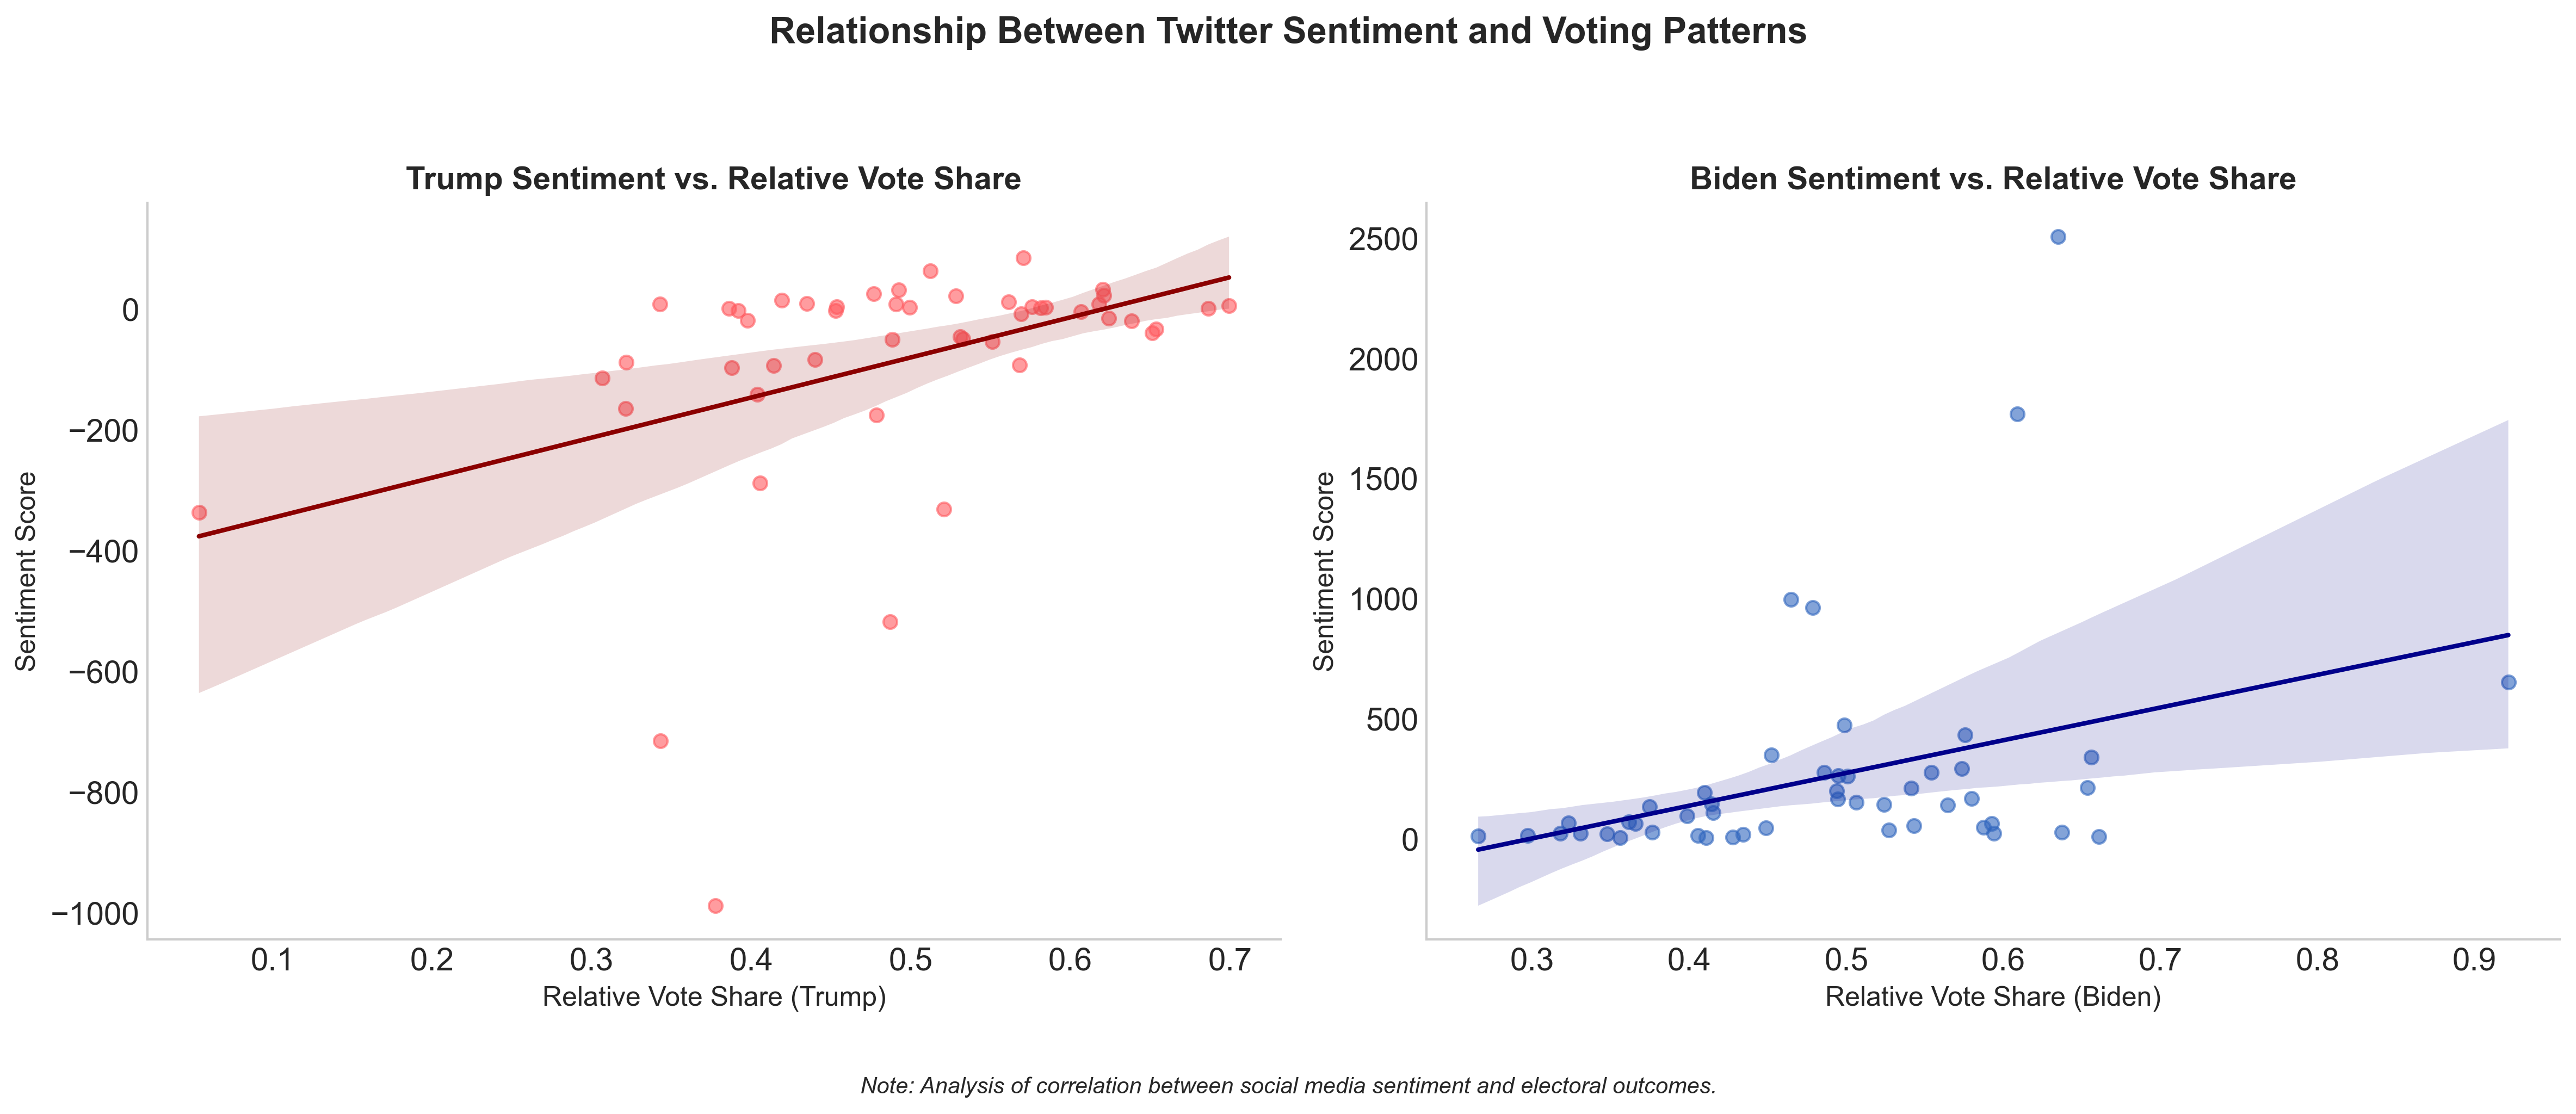
My research mapped sentiment and engagement across the United States, revealing fascinating regional variations. Coastal states like New York and California generally showed more positive sentiment toward Biden, while sentiment in central and southern regions was more mixed.
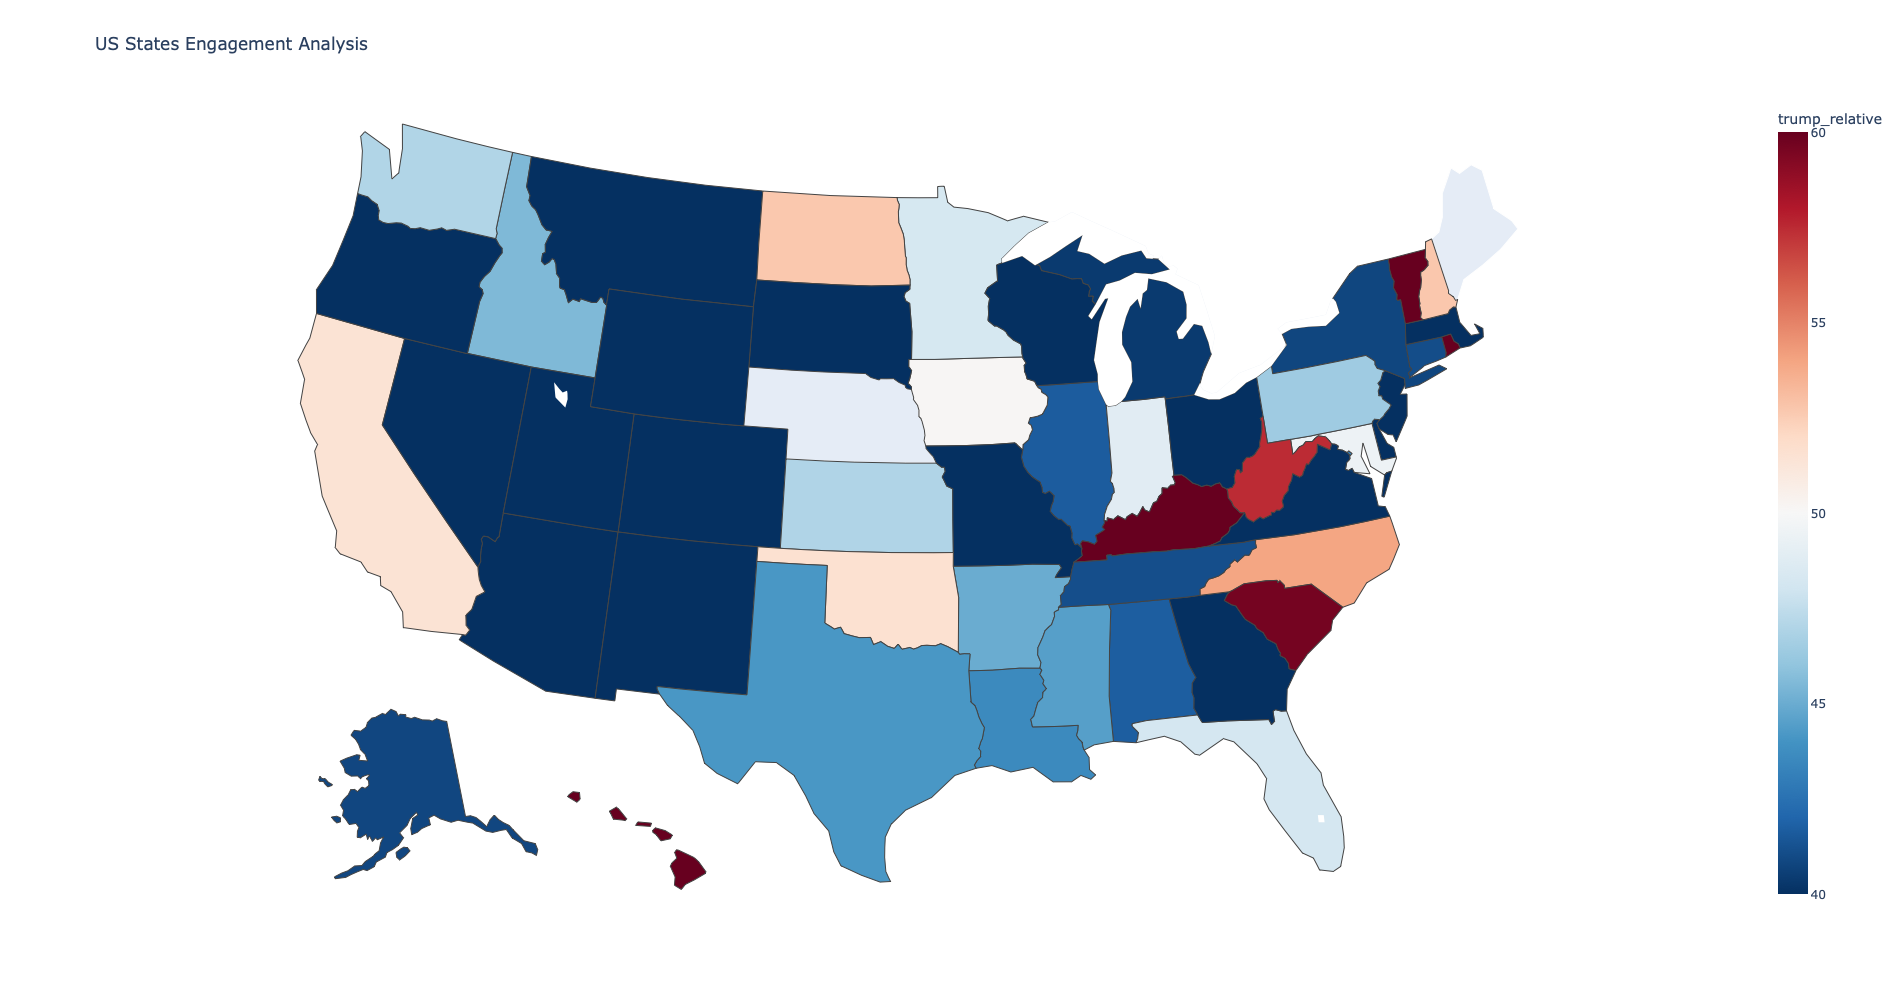
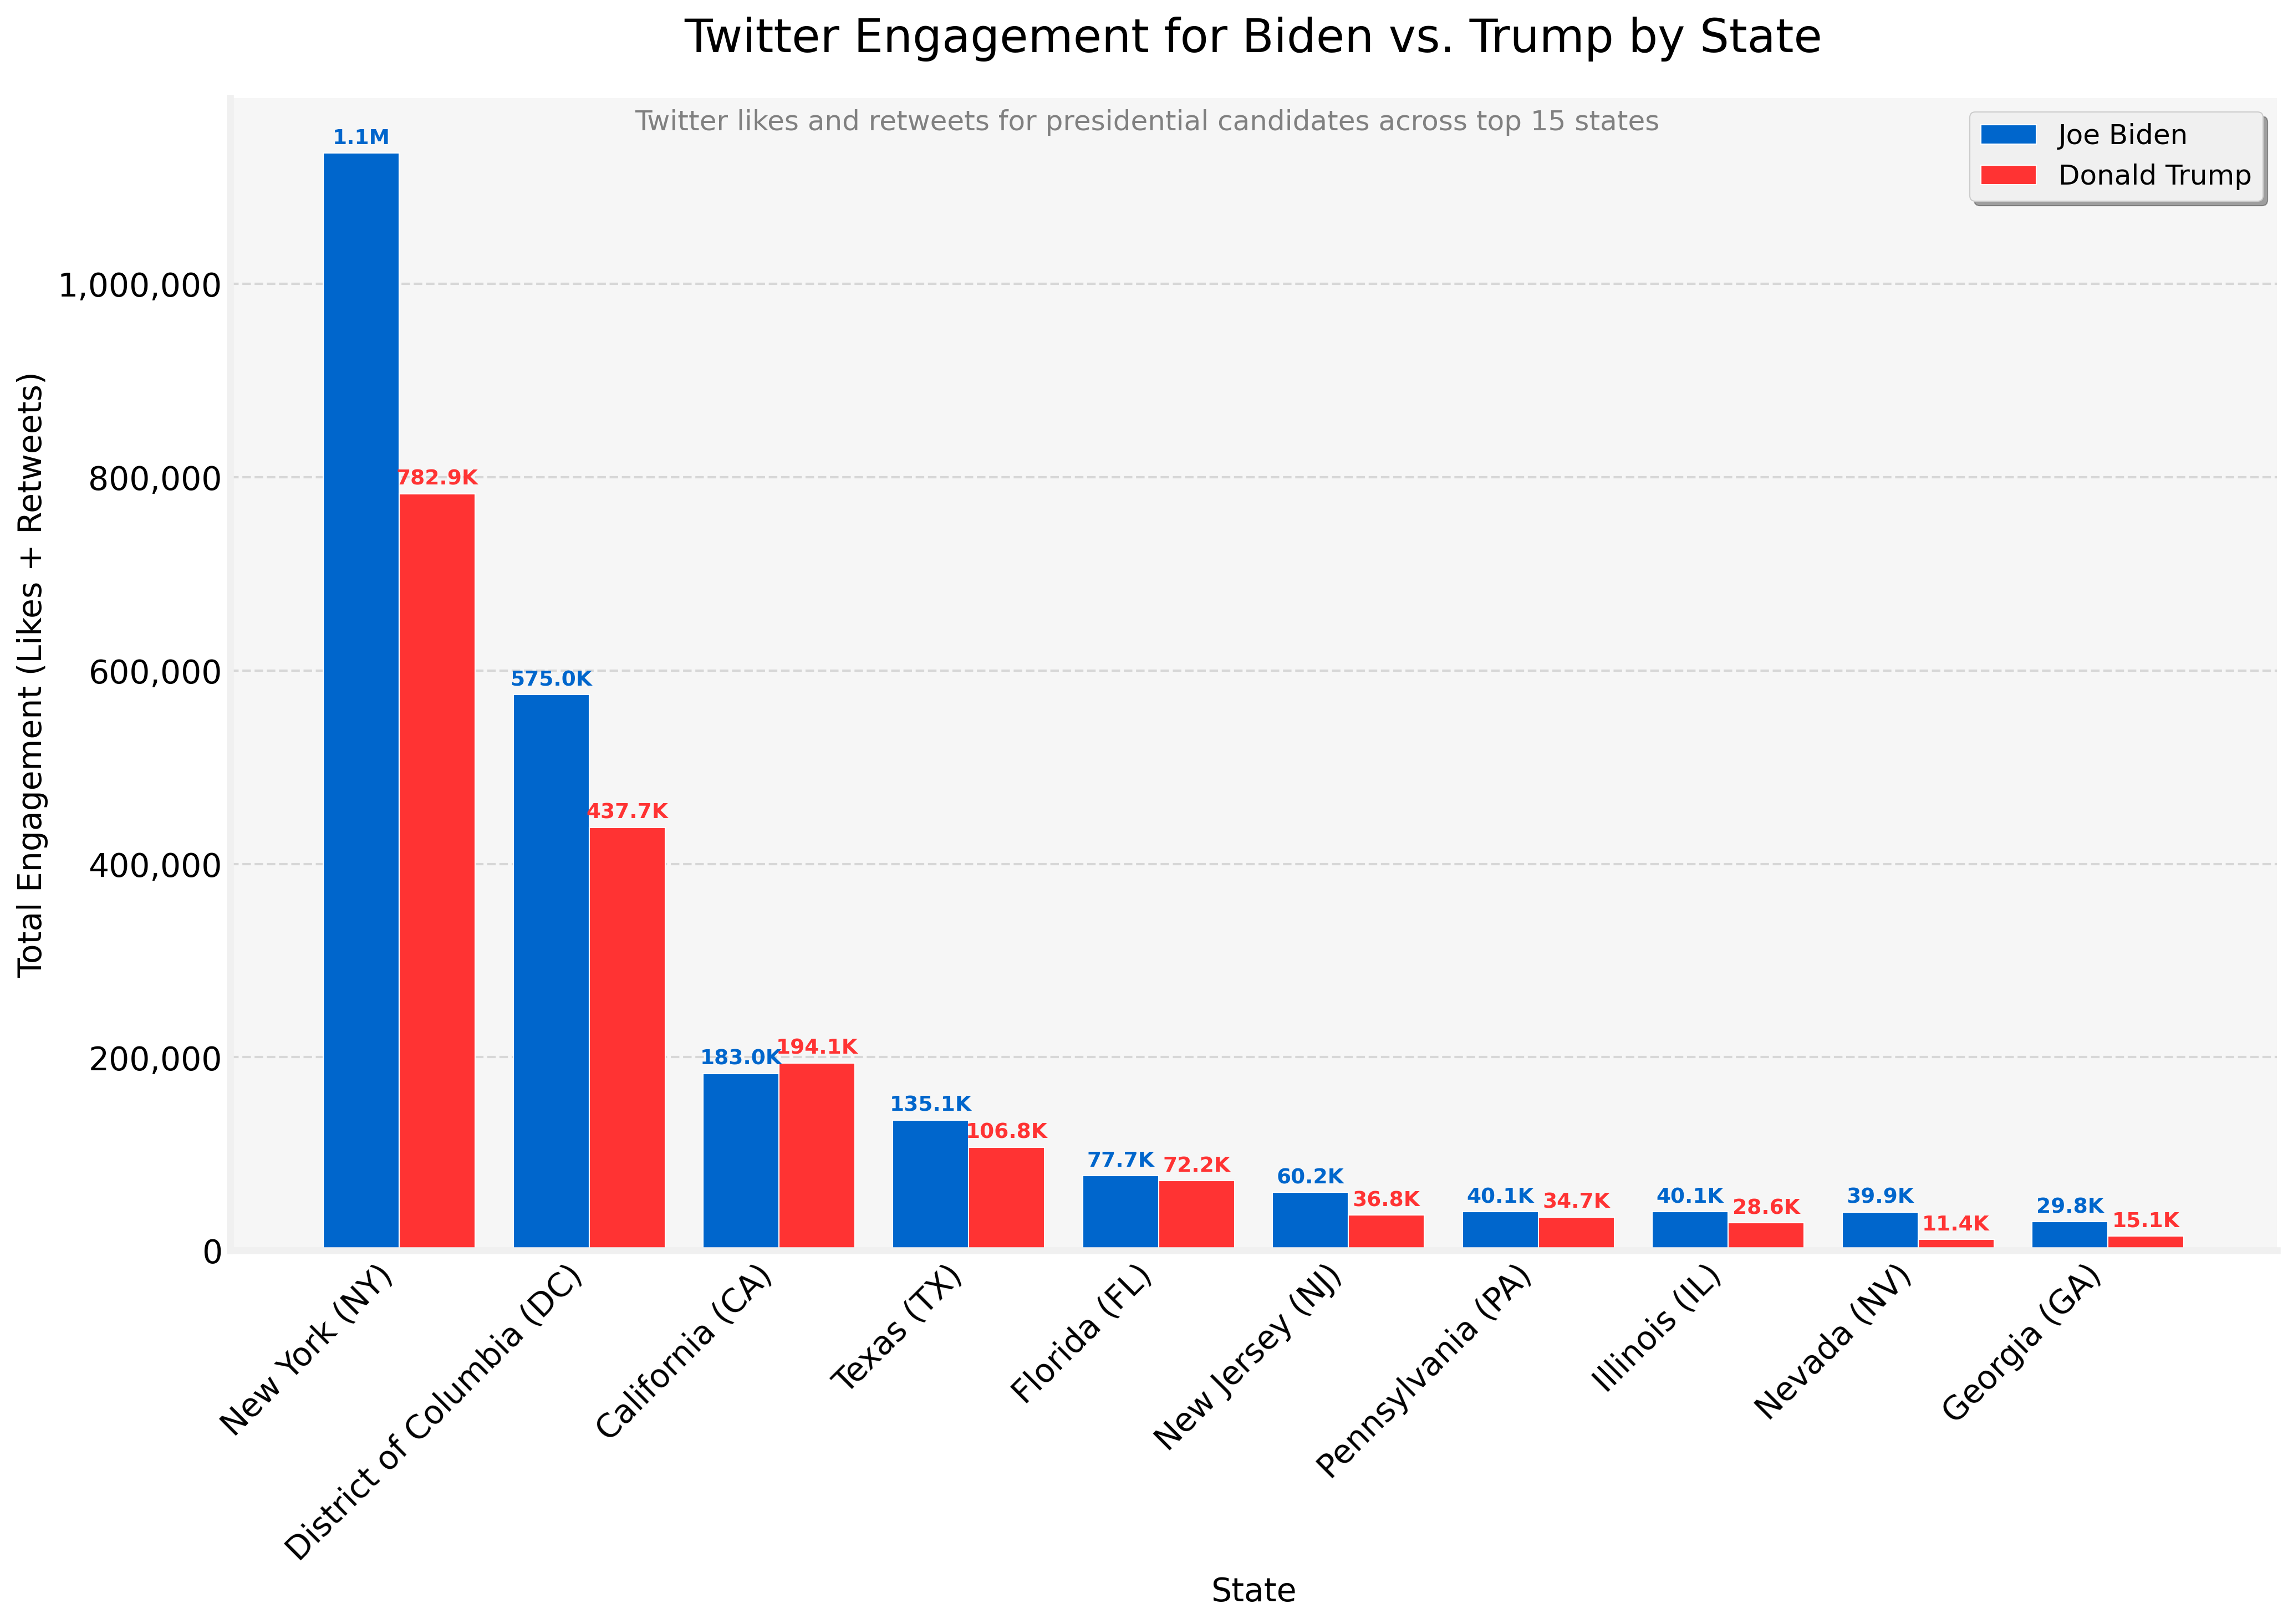
The Twitter engagement analysis of metrics (likes, retweets, and replies) showed that Biden consistently generated higher engagement than Trump across almost all states. Top states by engagement volume reveal a consistent pattern: Biden outperformed Trump in 9 out of 10 states analyzed.
Predictive Correlation & Machine Learning
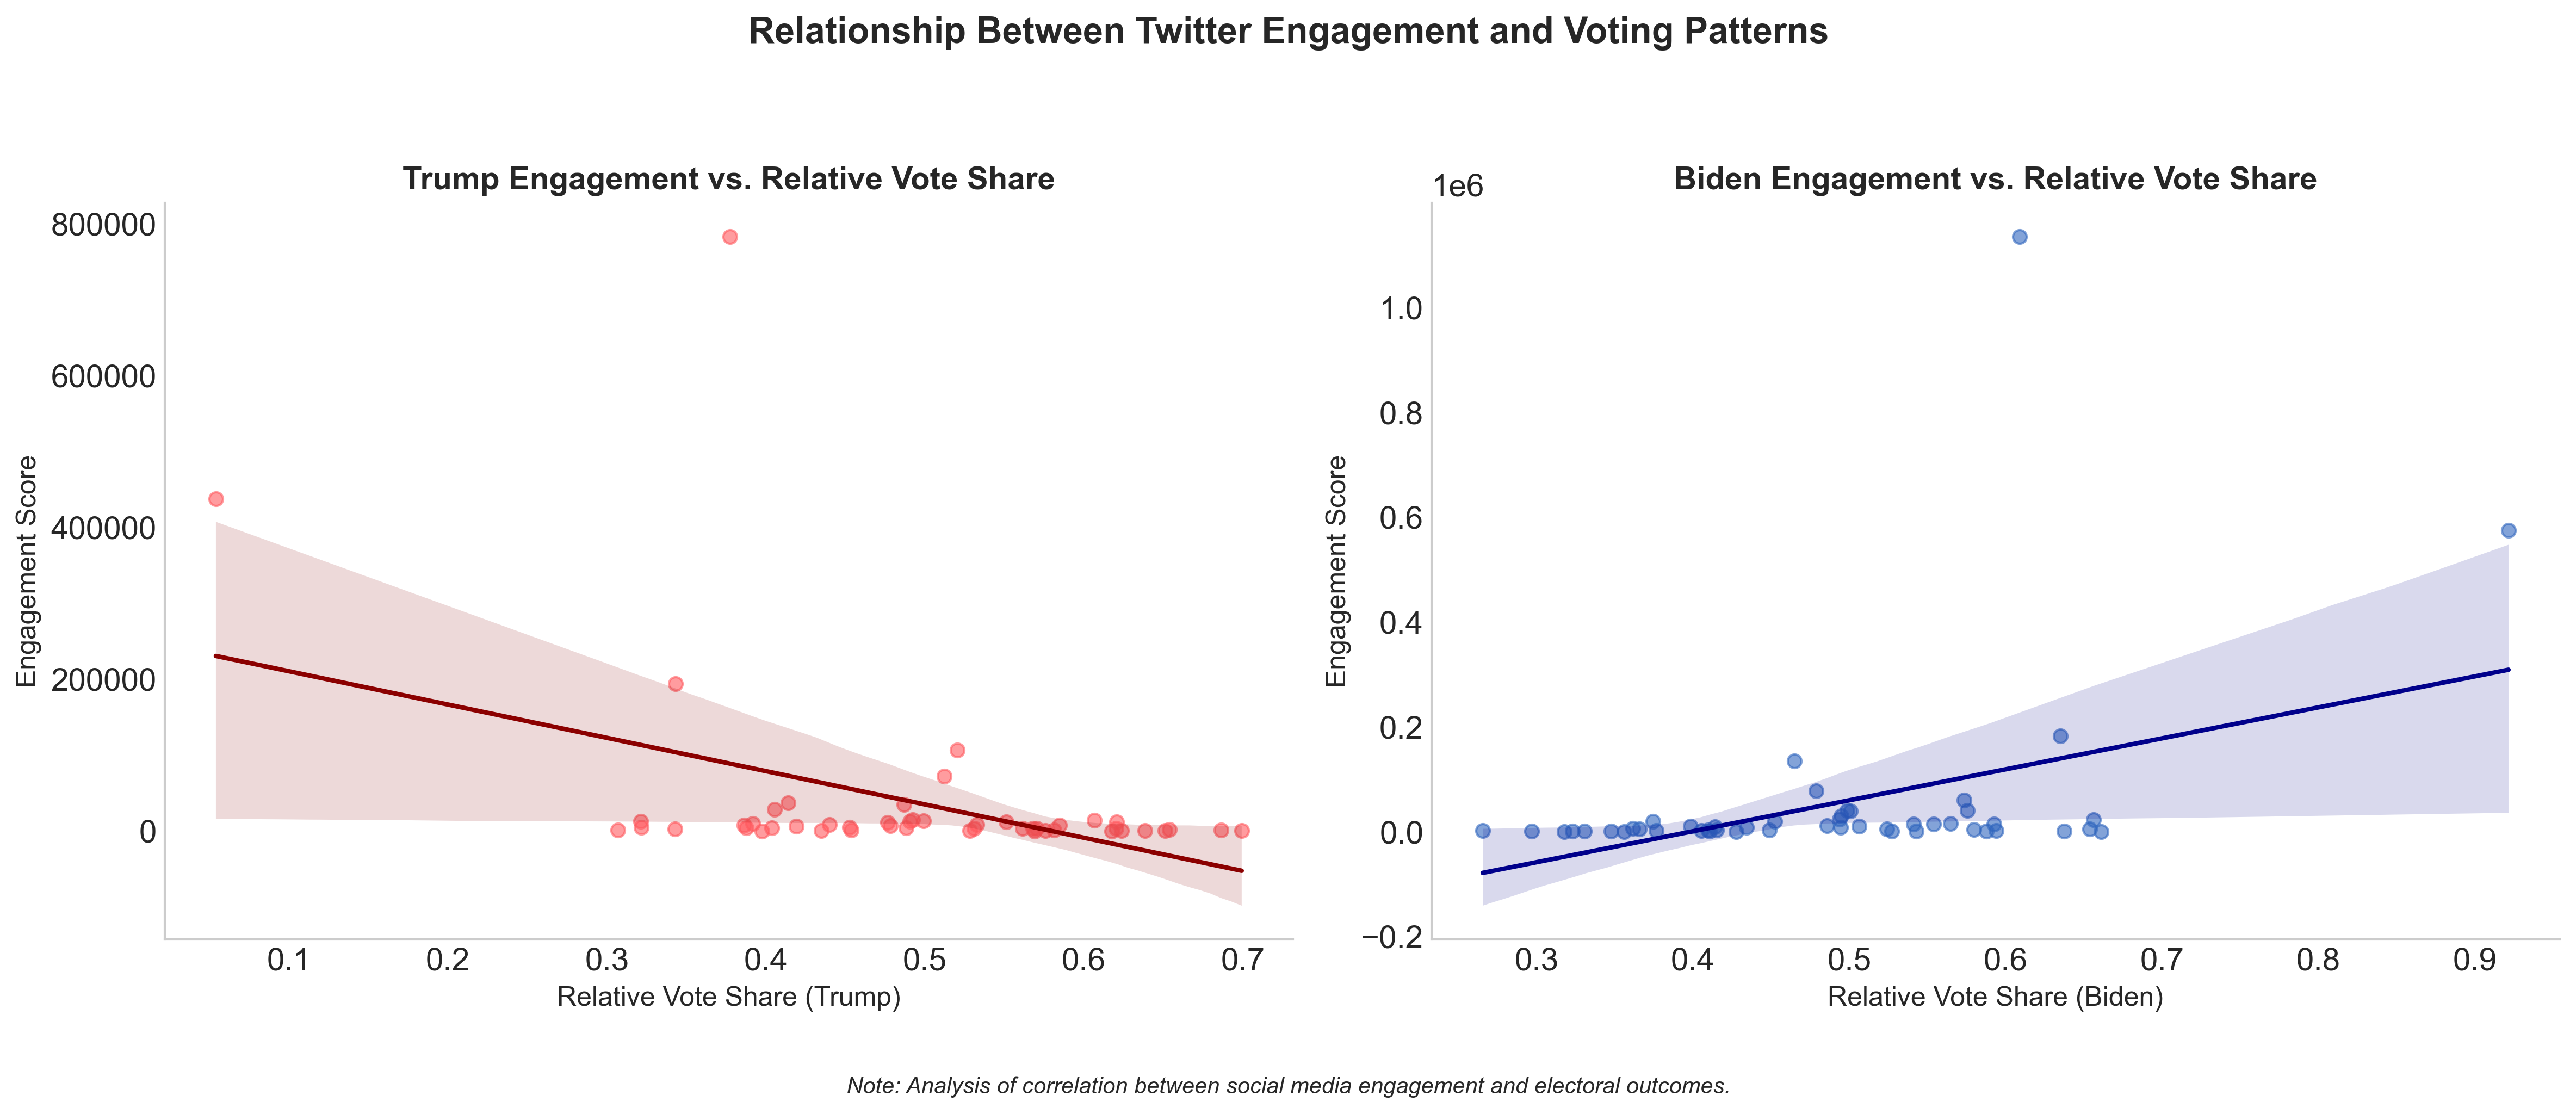
Looking at the correlation plots we can see there is a negative relationship between the number of engagements with tweets concerning Trump and relative vote share — meaning in states where there is lower engagement with Trump-related tweets, there is a higher relative vote share, emphasizing that not all engagements are positive.
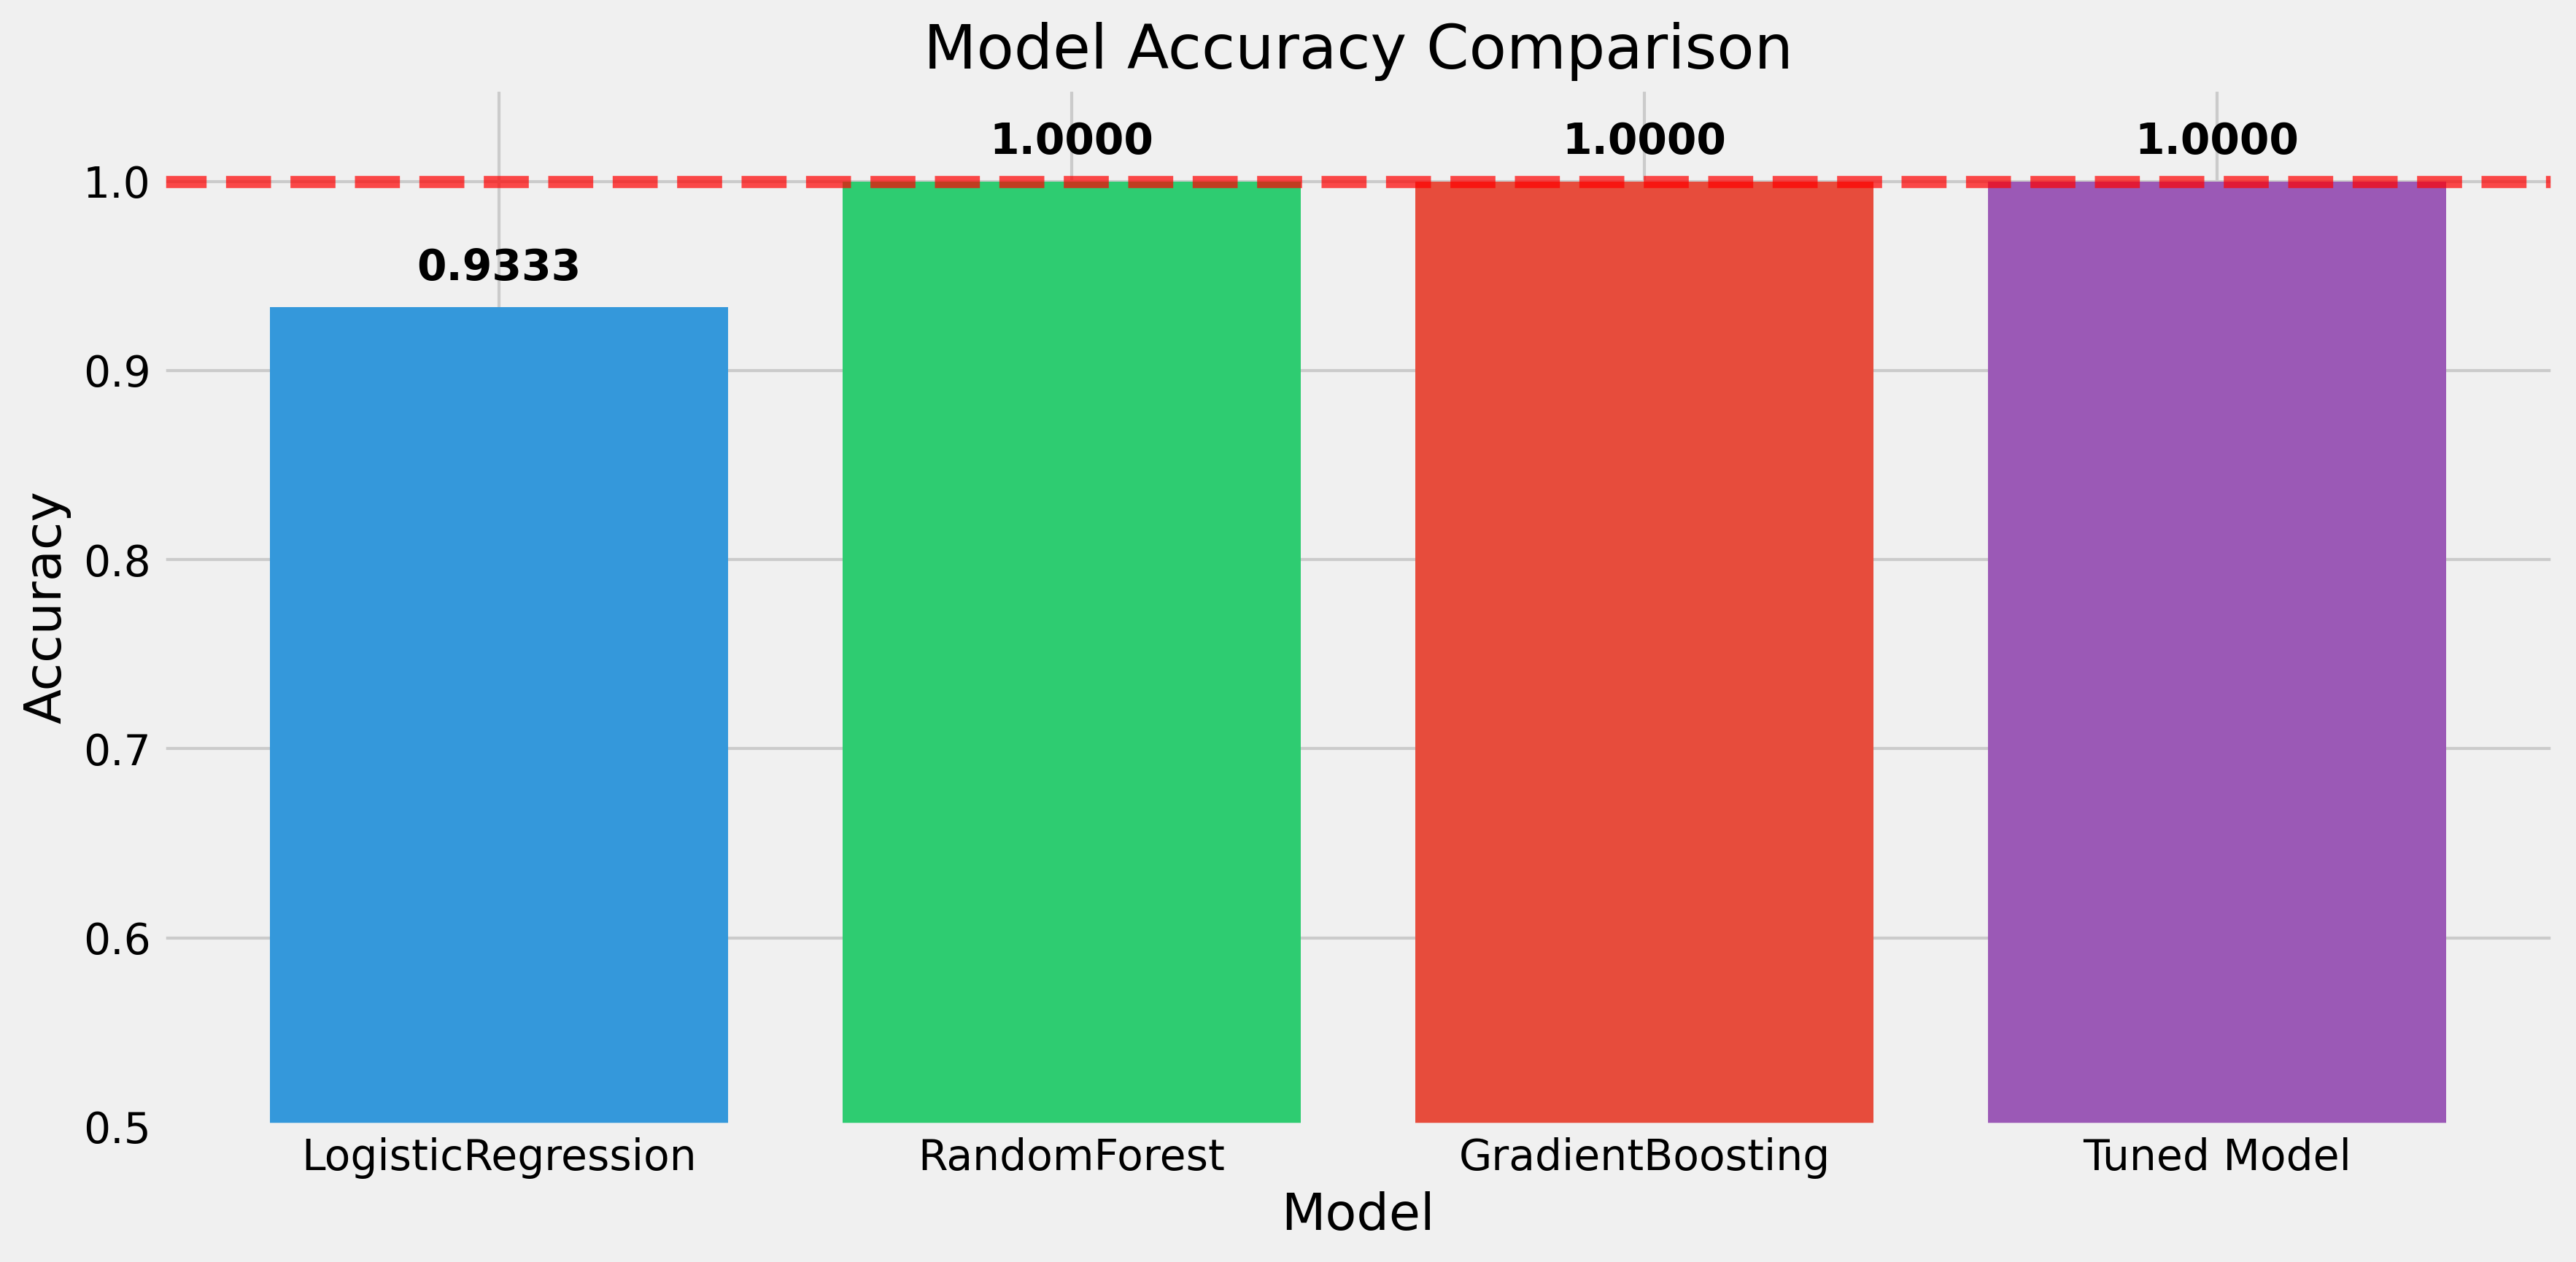
Finally, as a way to combine engagement and sentiment metrics into machine learning models, I trained the data on multiple algorithms. The ensemble methods (Random Forest, Gradient Boosting, and a Tuned Model) achieved perfect accuracy, correctly predicting the winner in every state in the test set. Even the simpler Logistic Regression model performed exceptionally well with 93.33% accuracy.
Impact & Conclusions
This research demonstrates that systematic analysis of Twitter sentiment and engagement can yield substantial predictive power for electoral outcomes. The implications extend beyond electoral predictions, suggesting new methods for understanding public opinion, tracking political sentiment in real-time, and potentially enhancing democratic processes through data science.
For more details, access the full research paper here ↗.